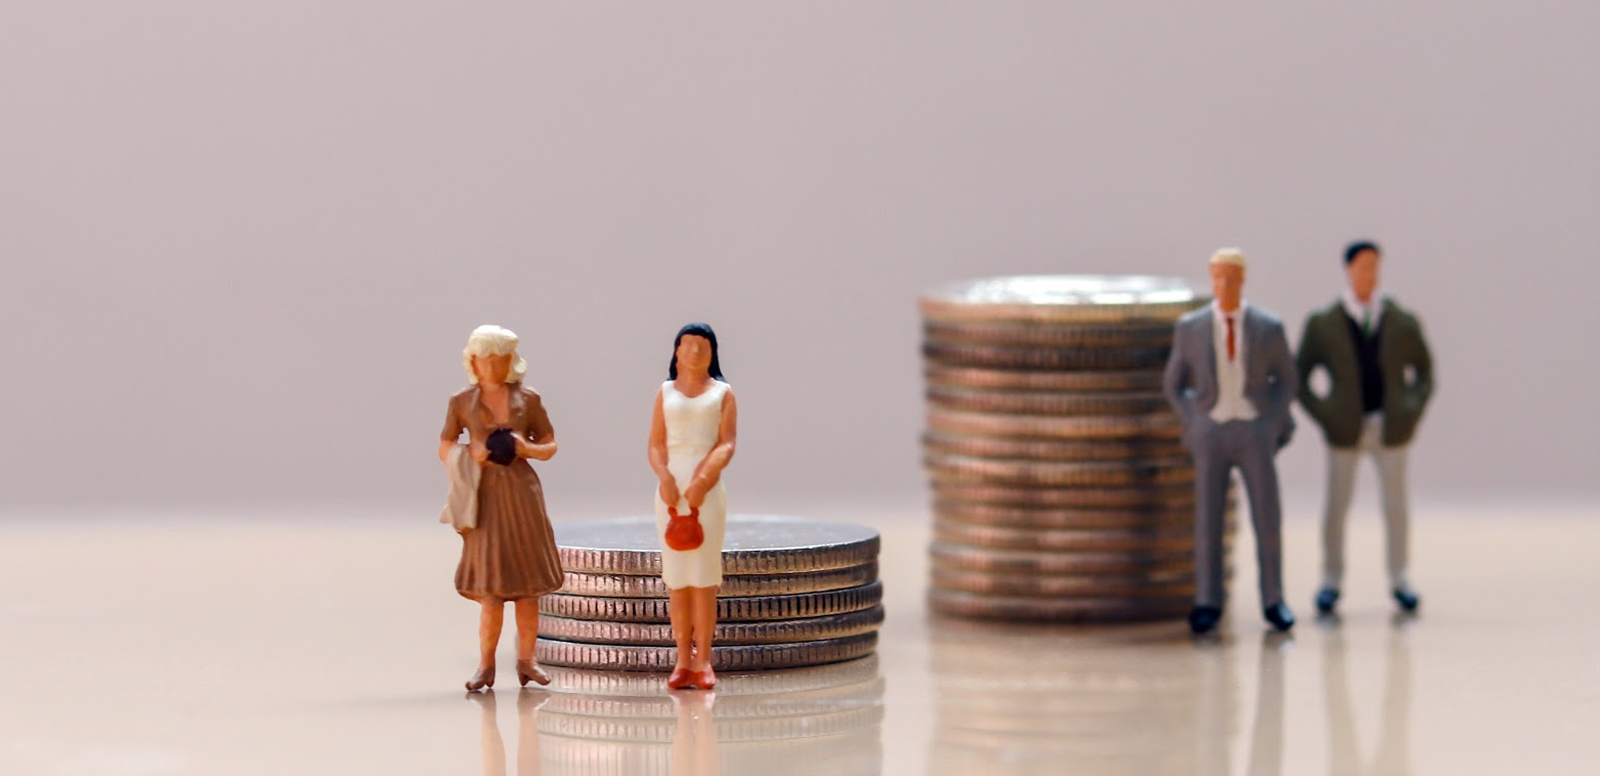
Pay equality was a running theme throughout the last election and plans were announced to close the gender pay gap by 2030 in the UK. However, the creative media sector is falling behind with a pay gap of 15%, a recent survey has revealed.
SJD Accountancy, part of the Optionis Group, found that the creative media gender pay gap has increased by a further 5% since 2018 and if this pay gap continues to increase at this rate, then experts fear that full pay equality by the next decade will not be achievable.
Highlighting these findings through this survey, especially for contractors, is essential for industries to see where they can improve and potentially eliminate the gender pay gap before this next decade closes. The importance of equality in the workplace is vital, especially as we’re heading into a new decade.
To further highlight the pay inequality, SJD have created a gender pay gap tool for people to check their own sector, with a focus on contract workers within a variety of industries – such as finance, health, science, accountancy, IT, and retail.
Out of 14 major industries surveyed, only two (engineering and pharmaceuticals) have seen a significant advancement in pay equality since 2018.
The sectors surveyed and their positive and negative pay gaps are as follows:
| Sector | 2018 Gap % | 2019 Gap % | Difference |
| Accountancy | 28% | 22% | 6% |
| Construction | N/a | 10% | N/a |
| Creative media | 10% | 15% | -5% |
| Education | N/a | 36% | N/a |
| Engineering | 6% | 4% | 2% |
| Financial services | 1% | 19% | -18% |
| Healthcare | -42% | 16% | -58% |
| IT | 8% | 12% | -4% |
| Manufacturing | N/a | 17% | N/a |
| Retail | N/a | 17% | N/a |
| Telecoms | 10% | 45% | -35% |
| Professional services | 9% | 23% | -14% |
| Oil, gas, energy | 49% | 66% | -17% |
| Pharmaceuticals | 41% | 10% | 31% |
N/a: Not surveyed in 2018.